Extrapolating Trends in Fitbit Usage to Guide the Marketing Strategy.
– A data analysis project by Hiba Shawa.
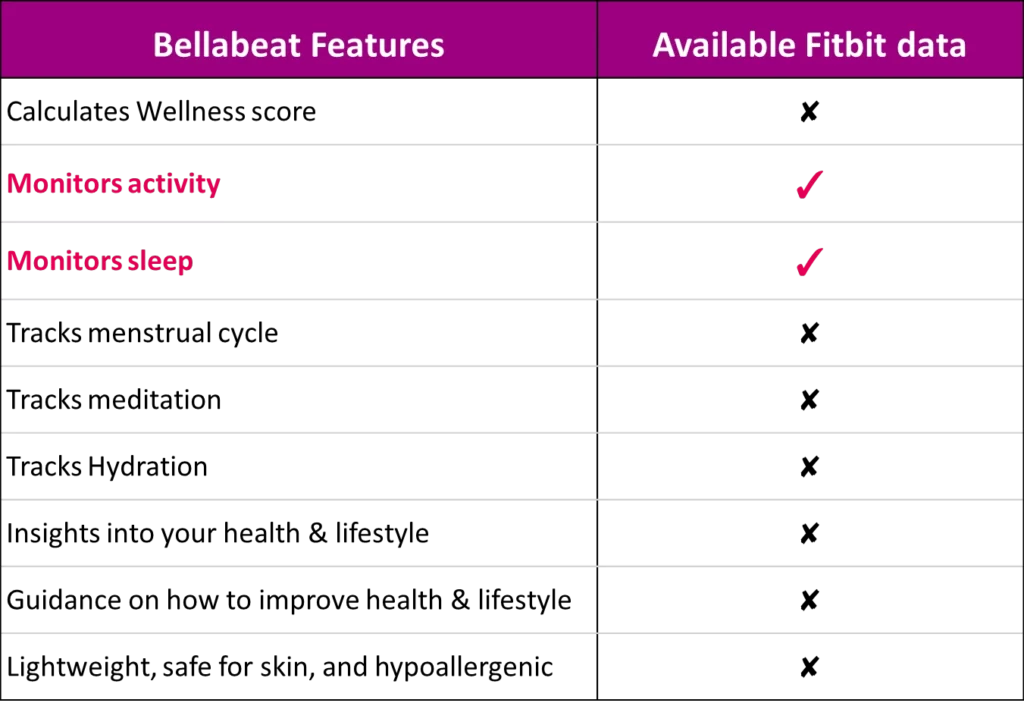
Bellabeat is a high-tech manufacturer of health-focused products for women.
One of it’s products, Time, is a wellness watch that combines the timeless look of a classic timepiece with smart technology.
“Time” tracks user activity, sleep, and stress.
The Time watch connects to the Bellabeat app to provide users with insights into their daily wellness.
Marketing is a key pillar in the growth of this company.
In this project I will be analyzing a similar health tracking watch to find trends…
The aim of this project was to determine how consumers use non-Bellabeats smart devices (ie. FitBit activity trackers), and use these insights to drive its marketing strategy.
“This dataset generated by respondents to a distributed survey via Amazon Mechanical Turk between 03.12.2016-05.12.2016.
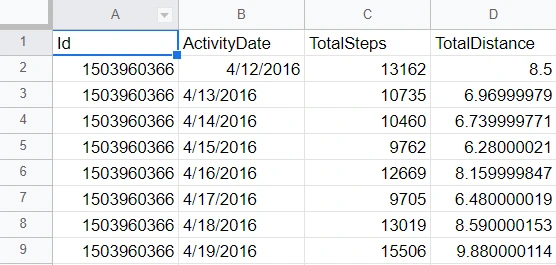
Thirty eligible Fitbit users consented to the submission of personal tracker data, including minute-level output for physical activity, heart rate, and sleepmonitoring.
Individual reports can be parsed by export session ID (column A) or timestamp (column B). Variation between output represents use of different types of Fitbit trackers and individual tracking behaviors / preferences. “
FitBit Fitness Tracker Data (CC0: Public Domain, dataset made available through Mobius): License: CC0 1.0 Universal (CC0 1.0). Public Domain Dedication : https://creativecommons.org/publicdomain/zero/1.0/
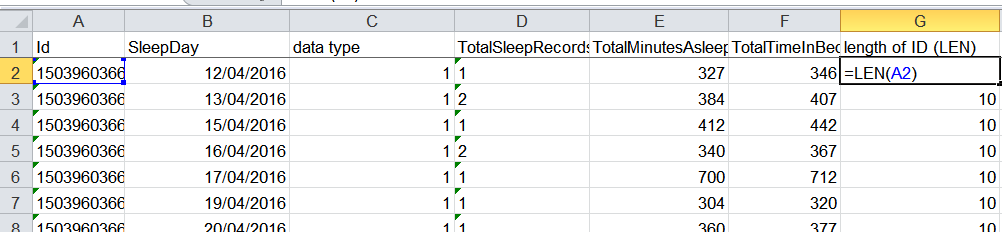
Number of entries is vastly different amongst participants
There is no information about specific models used. (to compare functions, battery life…)
No information about age or gender (Bellabeat is targeted towards women)
Not enough metadata description for the attributes.
Example: what is “sedentary active”?
Does “sedentary minutes” include sleep minutes? Do they overlap?
Dates: 12/04/2016 – 12/05/2016 (dd/mm/yyyy): There is discontinuity in entries for some IDs
Notes about Activity Data:
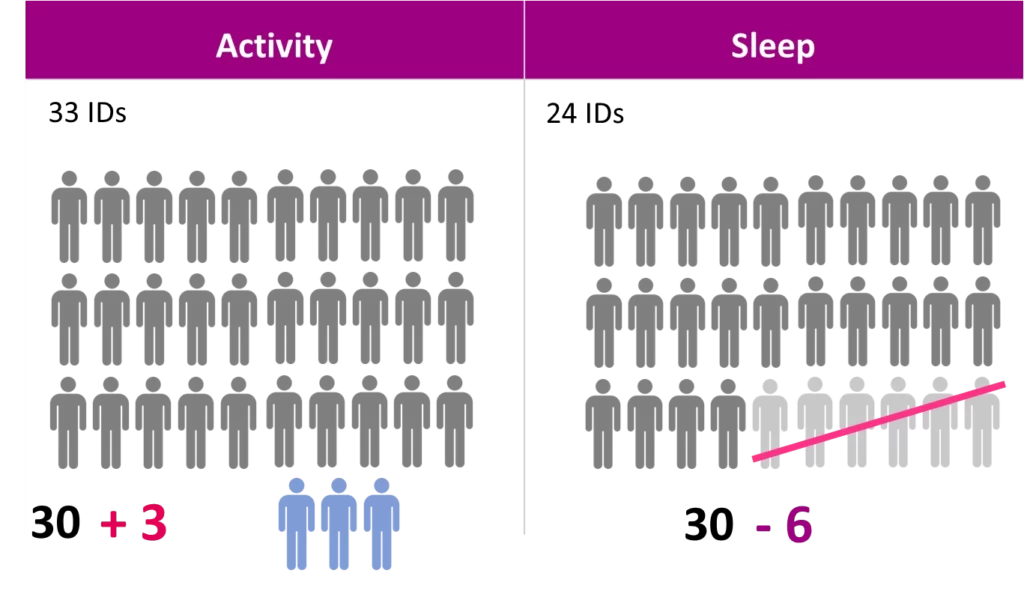
Count of unique IDs= 33 -> There are 3 extra participants? was there a mistake in entry?
Check ID length: all are 10 chr long
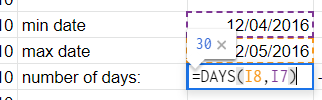
Min date: 4/12/2016
Max date: 5/12/2016
number of days in study description= 30 -> some participants had 31 entries?
No IDs had more than 1 entry/day
There were some entries with zero total steps and zero activity
Notes about Sleep Data:
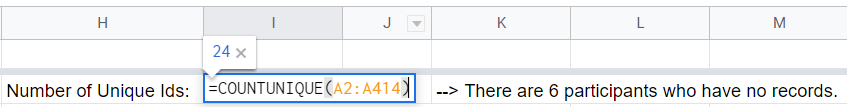
Number of Unique Ids: 24 –> There are 6 participants who have no records.
Filter to check length of IDs: all IDs are 10 characters long
Dates: 12/04/2016 – 12/05/2016 (dd/mm/yyyy) –> There is discontinuity in entries for some IDs
Does sedentary time include sleep time? How accurate is the device in differentiating between these two?
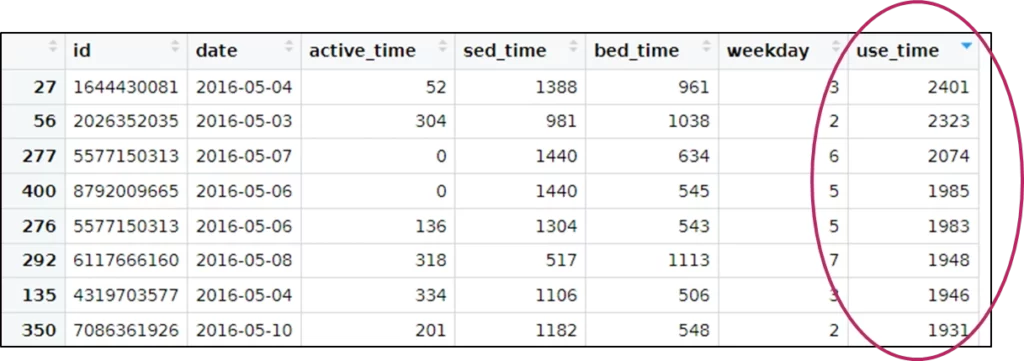
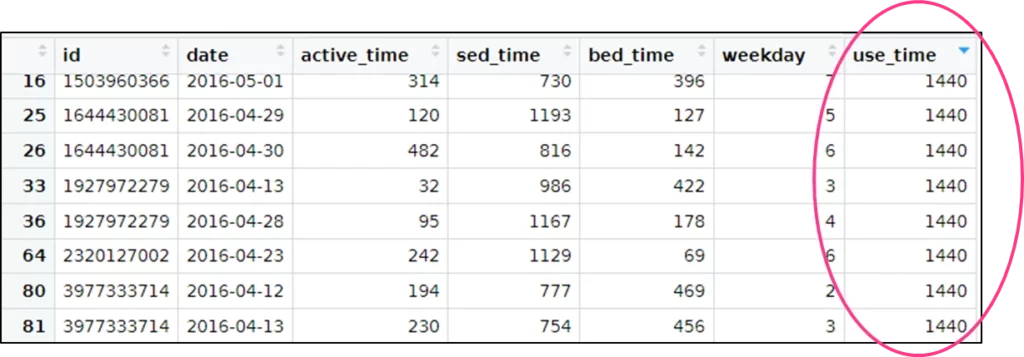
Some IDs had the 1440 minutes divided between sedentary minutes, active minutes and sleep minutes.
Some had 1440 sedentary minutes + >400 sleep minutes!
Logical error: When calculated in RStudio, some users had:
A Total time of usage >1440 minutes per day: Note: One day= 1440 minutes
could be due to overlap of sedentary and sleep minutes (recording minutes as both sedentary and sleep)?
As a result: I couldn’t use total time of usage in my analysis.
Other users had a Total time of usage = 1440 minutes:
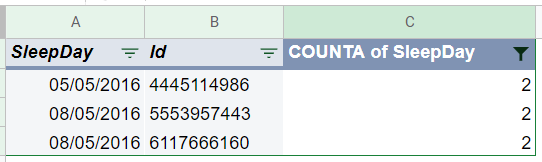
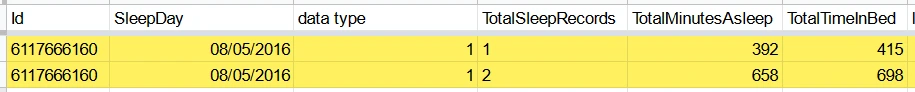
3 IDs had more than 2 entries/day (not duplicates) -> this resulted in some IDs having 31 entries
2 IDs had:
In one day: an entry with 2 in TotalSleepRecords+ another entry with 1 in TotalSleepRecords. (Total minutes asleep is greater than allowed by sum of active and sedentary minutes)
Fitbit: questions I asked
1) What did participants like to use it for more?Track activity, or track sleep?
2) Does usage differ with different days of the week? Working days vs weekends?
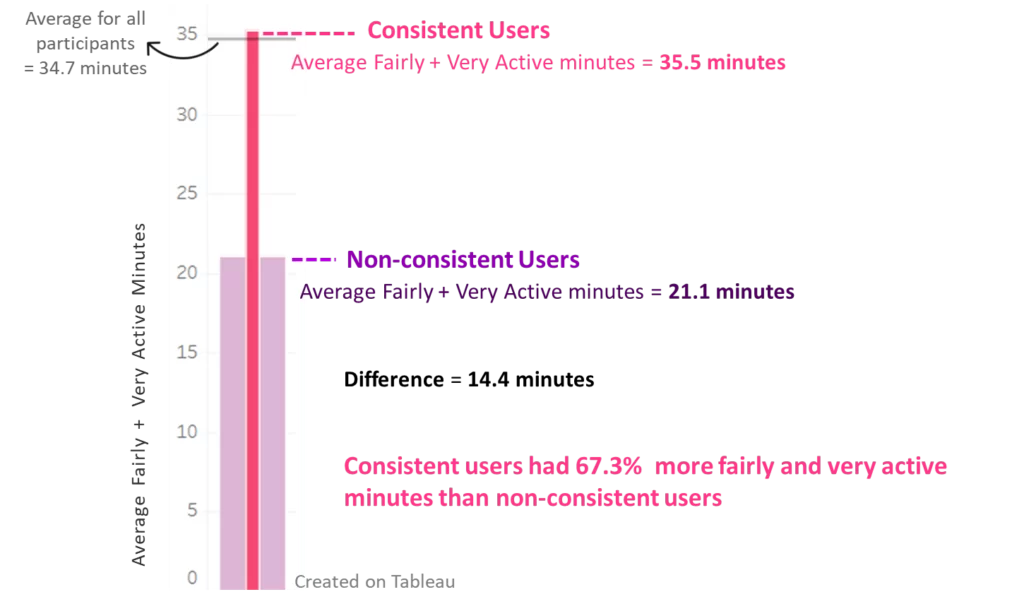
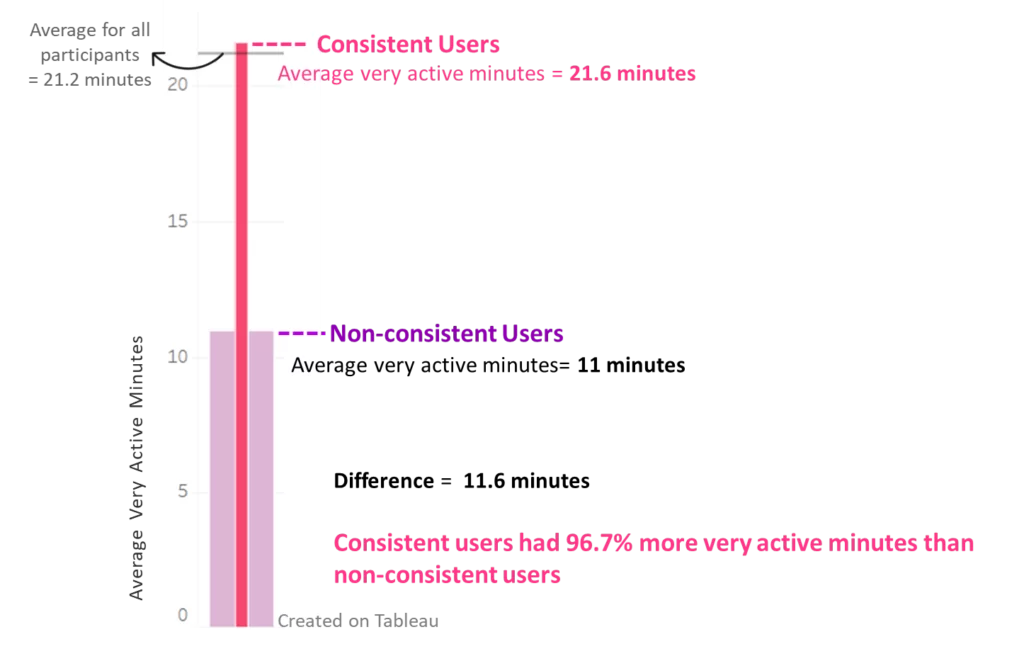
3) Is there any difference in average sleep and activity between consistent and non-consistent users? Is there a difference in a specific type of activity?
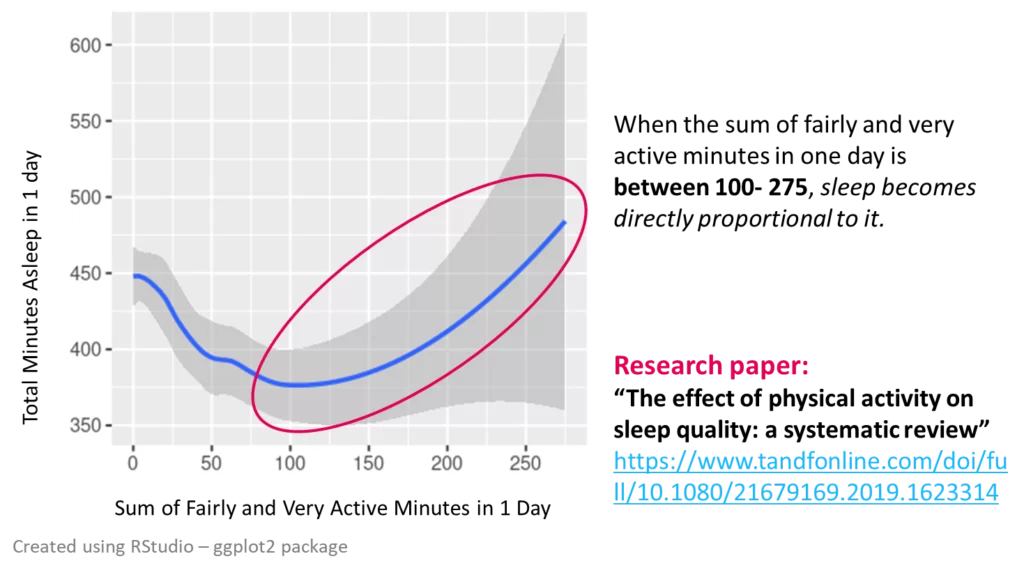
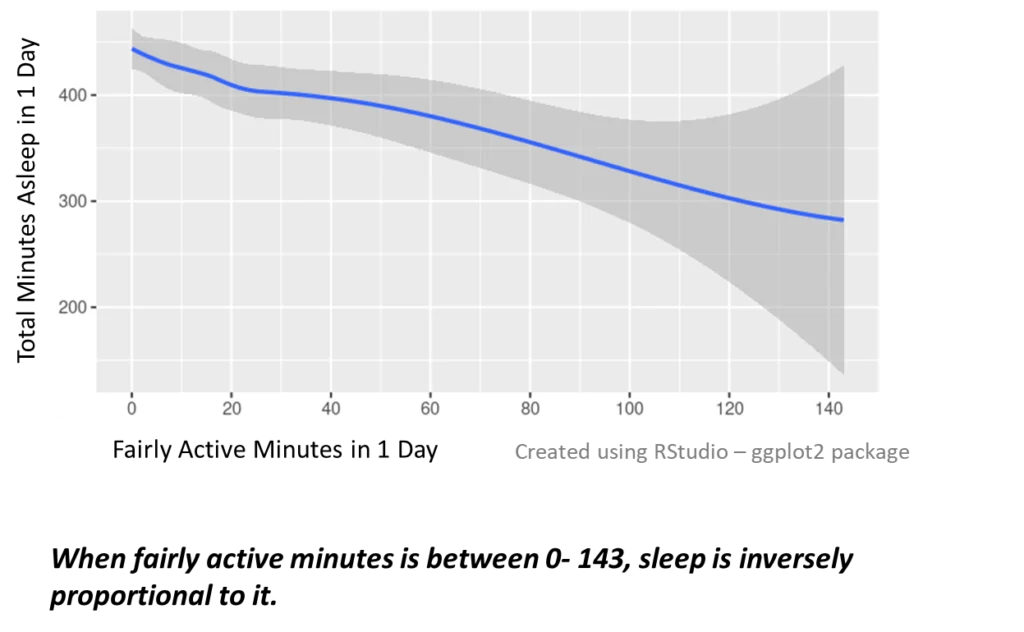
4) Is there any relationship between sleep and activity that we can use in our marketing strategy?
Eg. By keeping track of your activity and making sure that you’ve had your dose of highly active minutes, you can rest assured that you’ll have some good rest at night! (and you can track that with the device itself!)
5) How long did the participants wear it for? Is it tolerated well? Could this tell us something about the comfort level? Or aesthetics?
This couldn’t be analyzed due to error in total time of use.
We’ll assume that the most consistent users are the ones who like the device and are interested in using it – target group.
Did participants like to track activity? Or sleep?
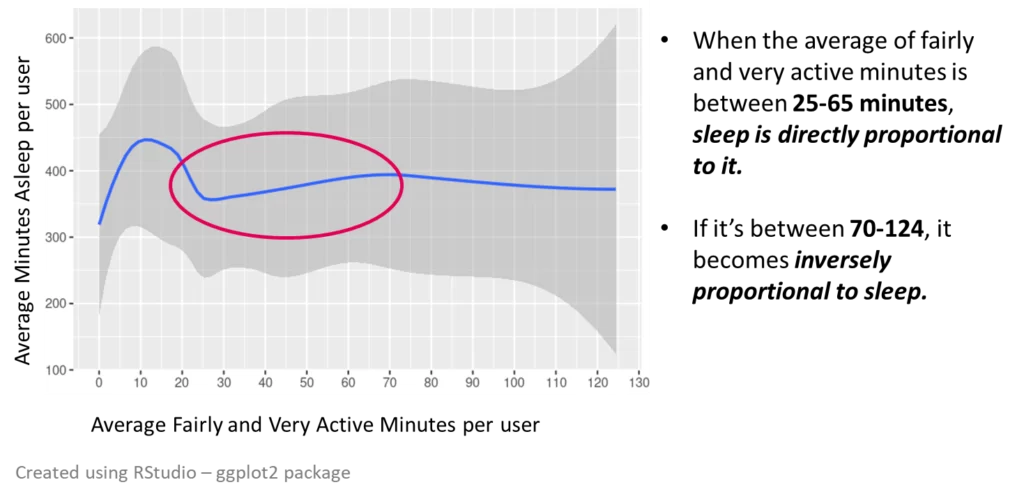
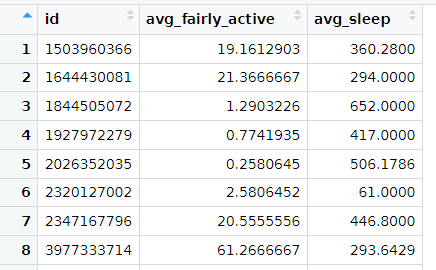
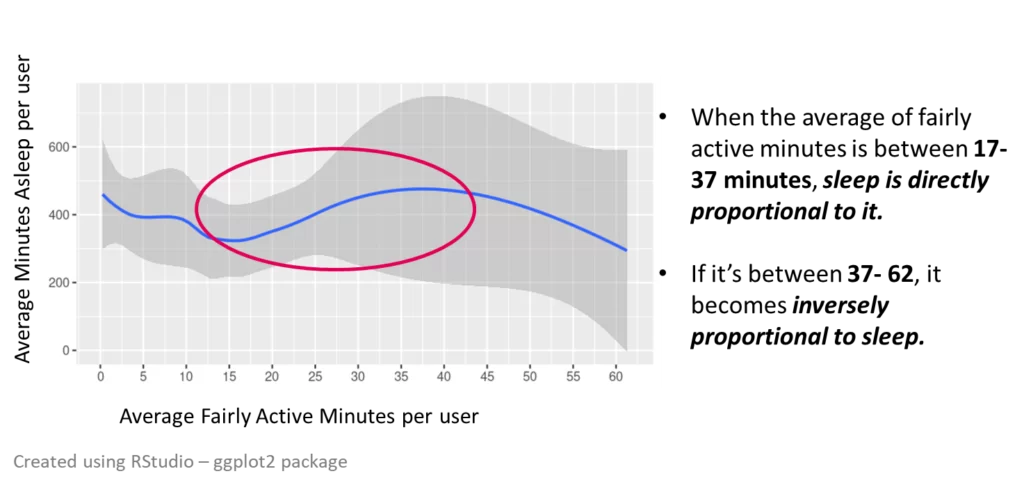
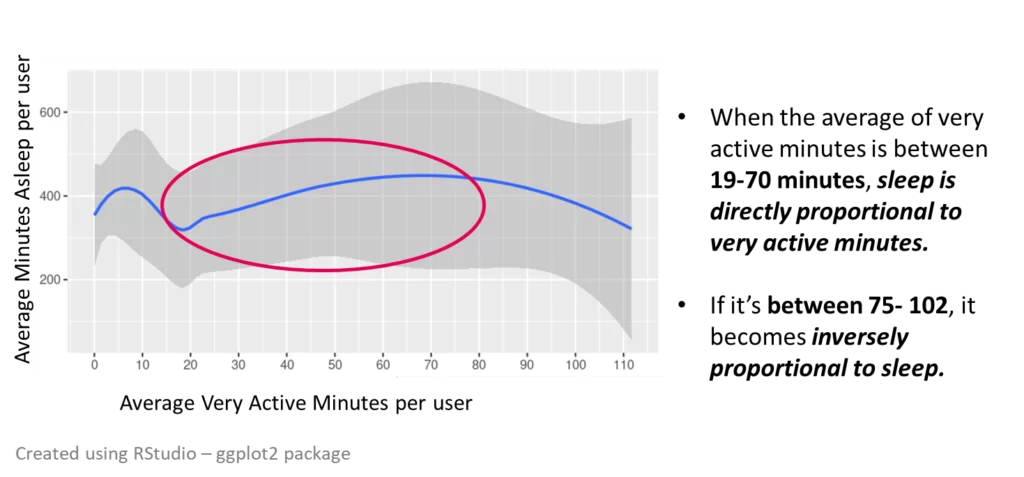
RStudio: Using group_by and summarise commands to create average data, and ggplot to visualize results.
Result and visualization of relationship between average of (fairly & very active minutes) and average sleep for each user through the whole time period:
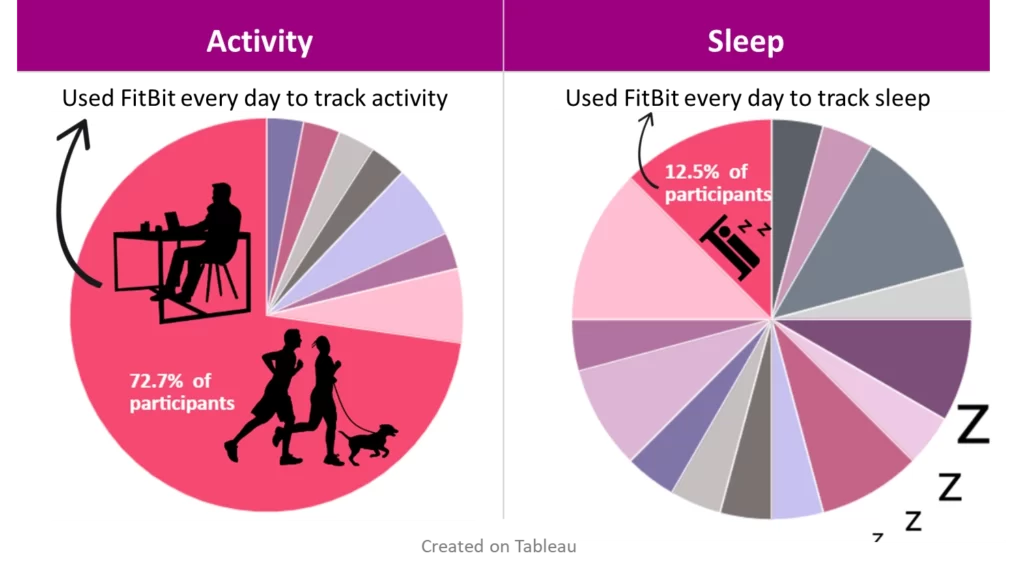
1) Device was used more frequently and consistently to track activity rather than sleep.
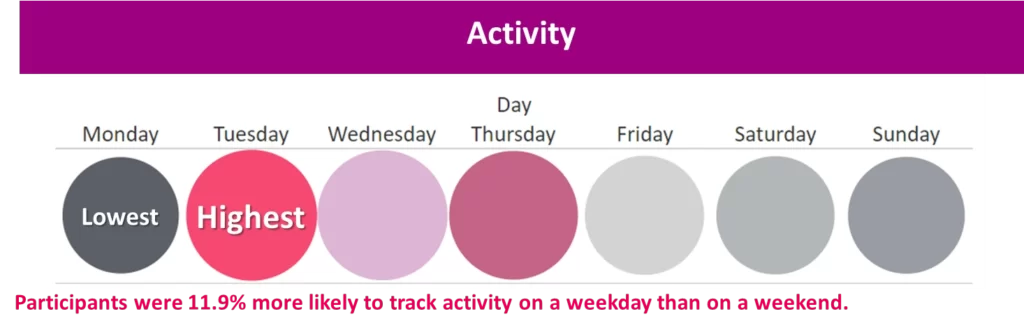
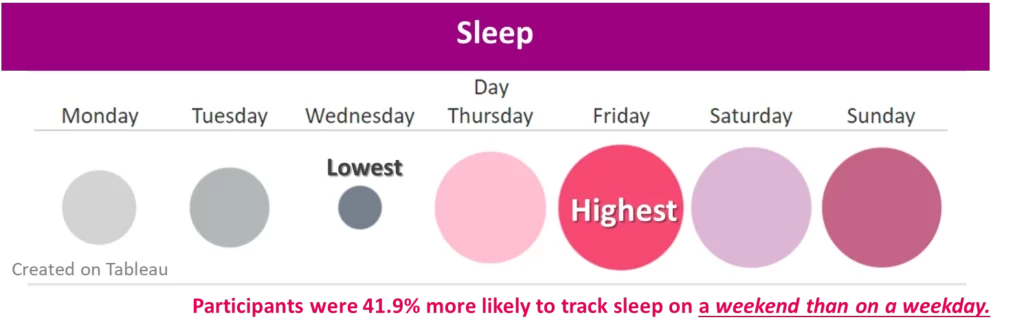
2) Users tend to track sleep much more on weekends than weekdays.
3) There wasn’t not much difference in activity tracking between weekdays and weekends.
Possible Questions
Are participants more interested in tracking activity than in tracking sleep?
A person can guess hours of sleep but not count of steps
The cause for less sleep tracking?
Is the battery running out at the end of the day?.
Is it an an issue of comfort?
Weekends: Better chance of charging for sleep tracking?
Weekends: Less worry of not getting good sleep due to comfort?
Recommended Actions
1) Focus on battery life: it will last x days on a single charge of x hours. (no need to worry about charging it in the middle of the day/ before going to sleep)
2) Focus on comfort level of the watch, or that it can be used while not worn?
3) Focus on tracking activity for this product, and focus on sleep when promoting other more suitable products.
As Featured In
This is a space to showcase any publications your work has been featured in
Thank you for taking the time to view my work!
For enquiries, please contact me on: shawahiba@gmail.com